
DNA methylation dynamics of human hematopoietic stem cell differentiation
Supplementary Online Resources
Abstract
Hematopoietic stem cells give rise to all blood cells in a differentiation process that involves widespread epigenome remodeling. Here we present genome-wide reference maps of the associated DNA methylation dynamics. We used a meta-epigenomic approach that combines DNA methylation profiles across many small pools of cells, and performed single-cell methylome sequencing to assess cell-to-cell heterogeneity. The resulting dataset identified characteristic differences between HSCs derived from fetal liver, cord blood, bone marrow, and peripheral blood. We also observed lineage-specific DNA methylation between myeloid and lymphoid progenitors, characterized immature multi-lymphoid progenitors, and detected progressive DNA methylation differences in maturing megakaryocytes. We linked these patterns to gene expression, histone modifications, and chromatin accessibility, and we used machine learning to derive a model of human hematopoietic differentiation directly from DNA methylation data. Our results contribute to a better understanding of human hematopoietic stem cell differentiation and provide a framework for studying blood-linked diseases.
Quick links
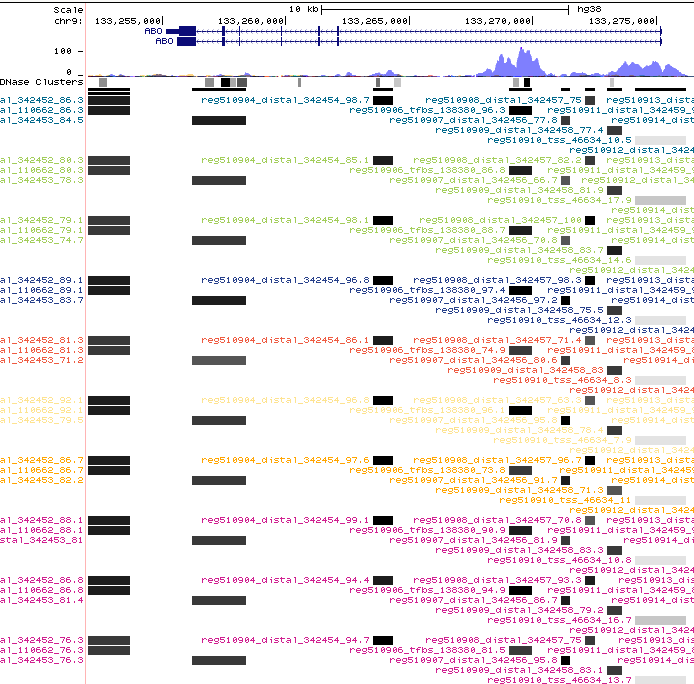
Genome browser tracks
DNA methylation data for visualization as genome browser tracks. Related to Figure 1 and Figure 2 of the paper.
| Name | Description and link |
|---|---|
| Genome browser | |
| Tutorials |
|
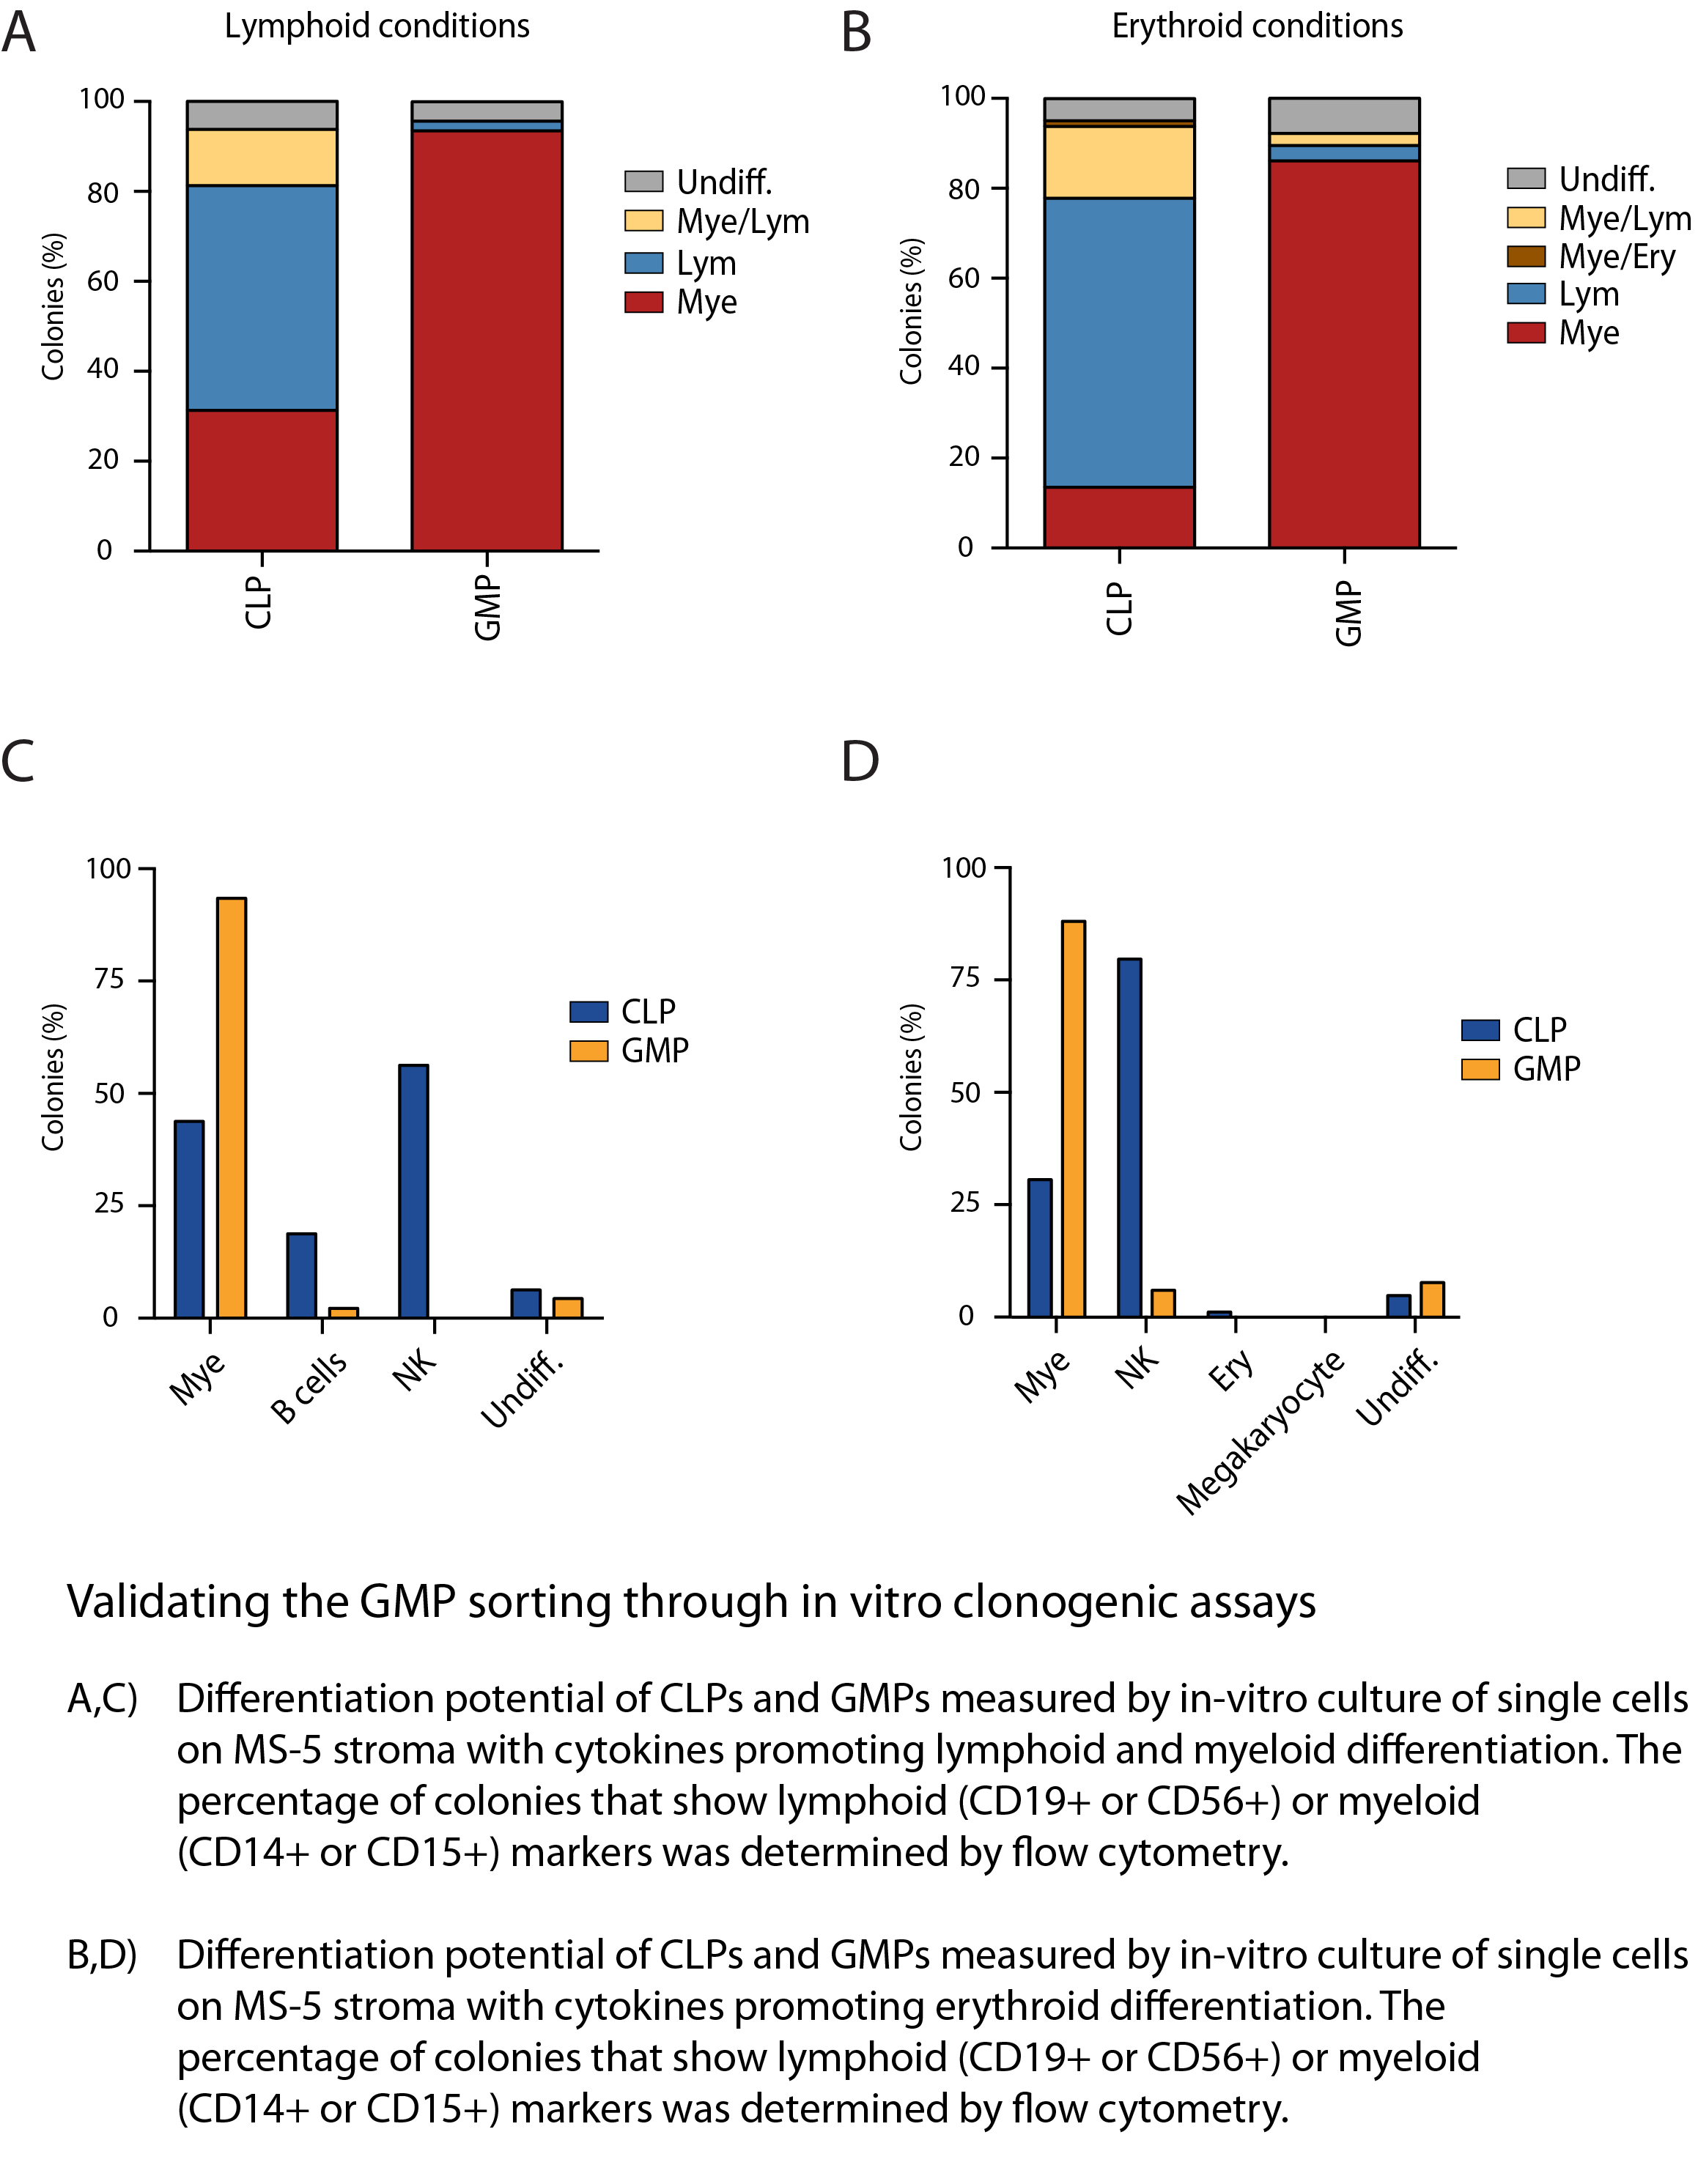
Cell sorting and characterization
Additional materials related to cell sorting and the in-vitro differentiation experiments. Related to Figure 4 (and others) of the paper.
| Name | Description and link |
|---|---|
| FACS data |
|
| Characterization |
|
DNA methylation differences between blood sources
Additional materials related to the comparison of HSCs and MPPs from different blood sources. Related to Figure 2 of the paper.
| Name | Description and link |
|---|---|
| ChIP-seq overlaps |
|
Epigenetic separation of myeloid and lymphoid progenitors
Additional materials related to the analysis of DNA methylation differences between the myeloid and lymphoid lineage. Related to Figure 3 of the paper.
| Name | Description and link |
|---|---|
| DNA methylation landscape based on TFBS methylation |
|
| Single-cell methylomes |
|
Immature lymphoid progenitors
Additional materials related to the analysis of immature lymphoid progenitor populations (MLP0-3). Related to Figure 4 of the paper.
| Name | Description and link |
|---|---|
| DNA methylation landscape based on TFBS methylation |
|
| Single-cell and low-input methylomes |
|
Megakaryocyte maturation
Additional materials related to the analysis of DNA methylation dynamics during megakaryocyte maturation Related to Figure 5 of the paper.
| Name | Description and link |
|---|---|
| Differentially methylated region sets (32N vs 2N) |
|
Data integration
Additional materials related to the comparison of the DNA methylation-based epigenetic profiles of human blood progenitors with other types of data. Related to Figure 6 of the paper.
| Name | Description and link |
|---|---|
| Gene expression |
|
| Histone modications |
|
| Chromatin accessibility |
|
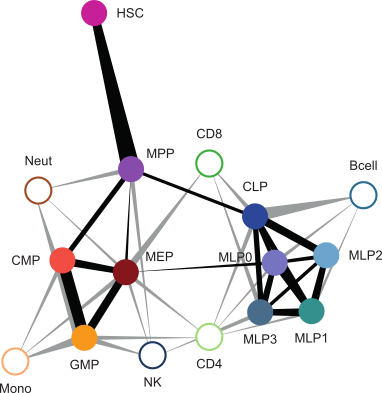
Cell type prediction
Additional materials related to the inference of cell type based on DNA methylation signature . We trained the classifiers based on progenitor methylome data and used class probabilities to reconstruct a data-driven view of hematopoeitic differentiation. Related to Figure 7 of the paper.
| Name | Description and link |
|---|---|
| Code |
|
Addenda
Differentially methylated regions
Differential methylation calls for the comparisons discussed in the paper and others.
| Name | Description and link |
|---|---|
| Differential methylation analysis |
In the paper presenting this resource, we discussed the results of several differential methylation analyses using RnBeads. These comparisons all took gender, flowcell, and number of cells in each pool as covariates into account. However, due to missing values, the complete statistical models with covariates were underdefined in some additional comparisons that were not directly used in the paper (not enough residual degrees of freedom) and no p-values could be calculated in these cases. We therefore provide an alternative version of the table based on differential methylation analysis without covariate adjustment. In line with Table S2 of the paper, each table presents a single number per comparison: "1" = increased DNA methylation, "-1" = decreased DNA methylation, "0" = no significant difference in DNA methylation, "NA" = no call possible due to missing data.
|
Low-input sequencing and technical artifacts
Examination of the effect of cell pool size and other experimental variables on the analysis results presented.
| Name | Description and link |
|---|---|
| Differential methylation analysis with different cell pool sizes |
In order to confirm that our analyses results were robust to minor technical differences between cell pools of different sizes, we repeated the differential methylation analysis between myeloid and lymphoid progenitors only with cells of a certain pool size and achieve compatible results in all cases. Plots (equivalent to Figure 3):
|
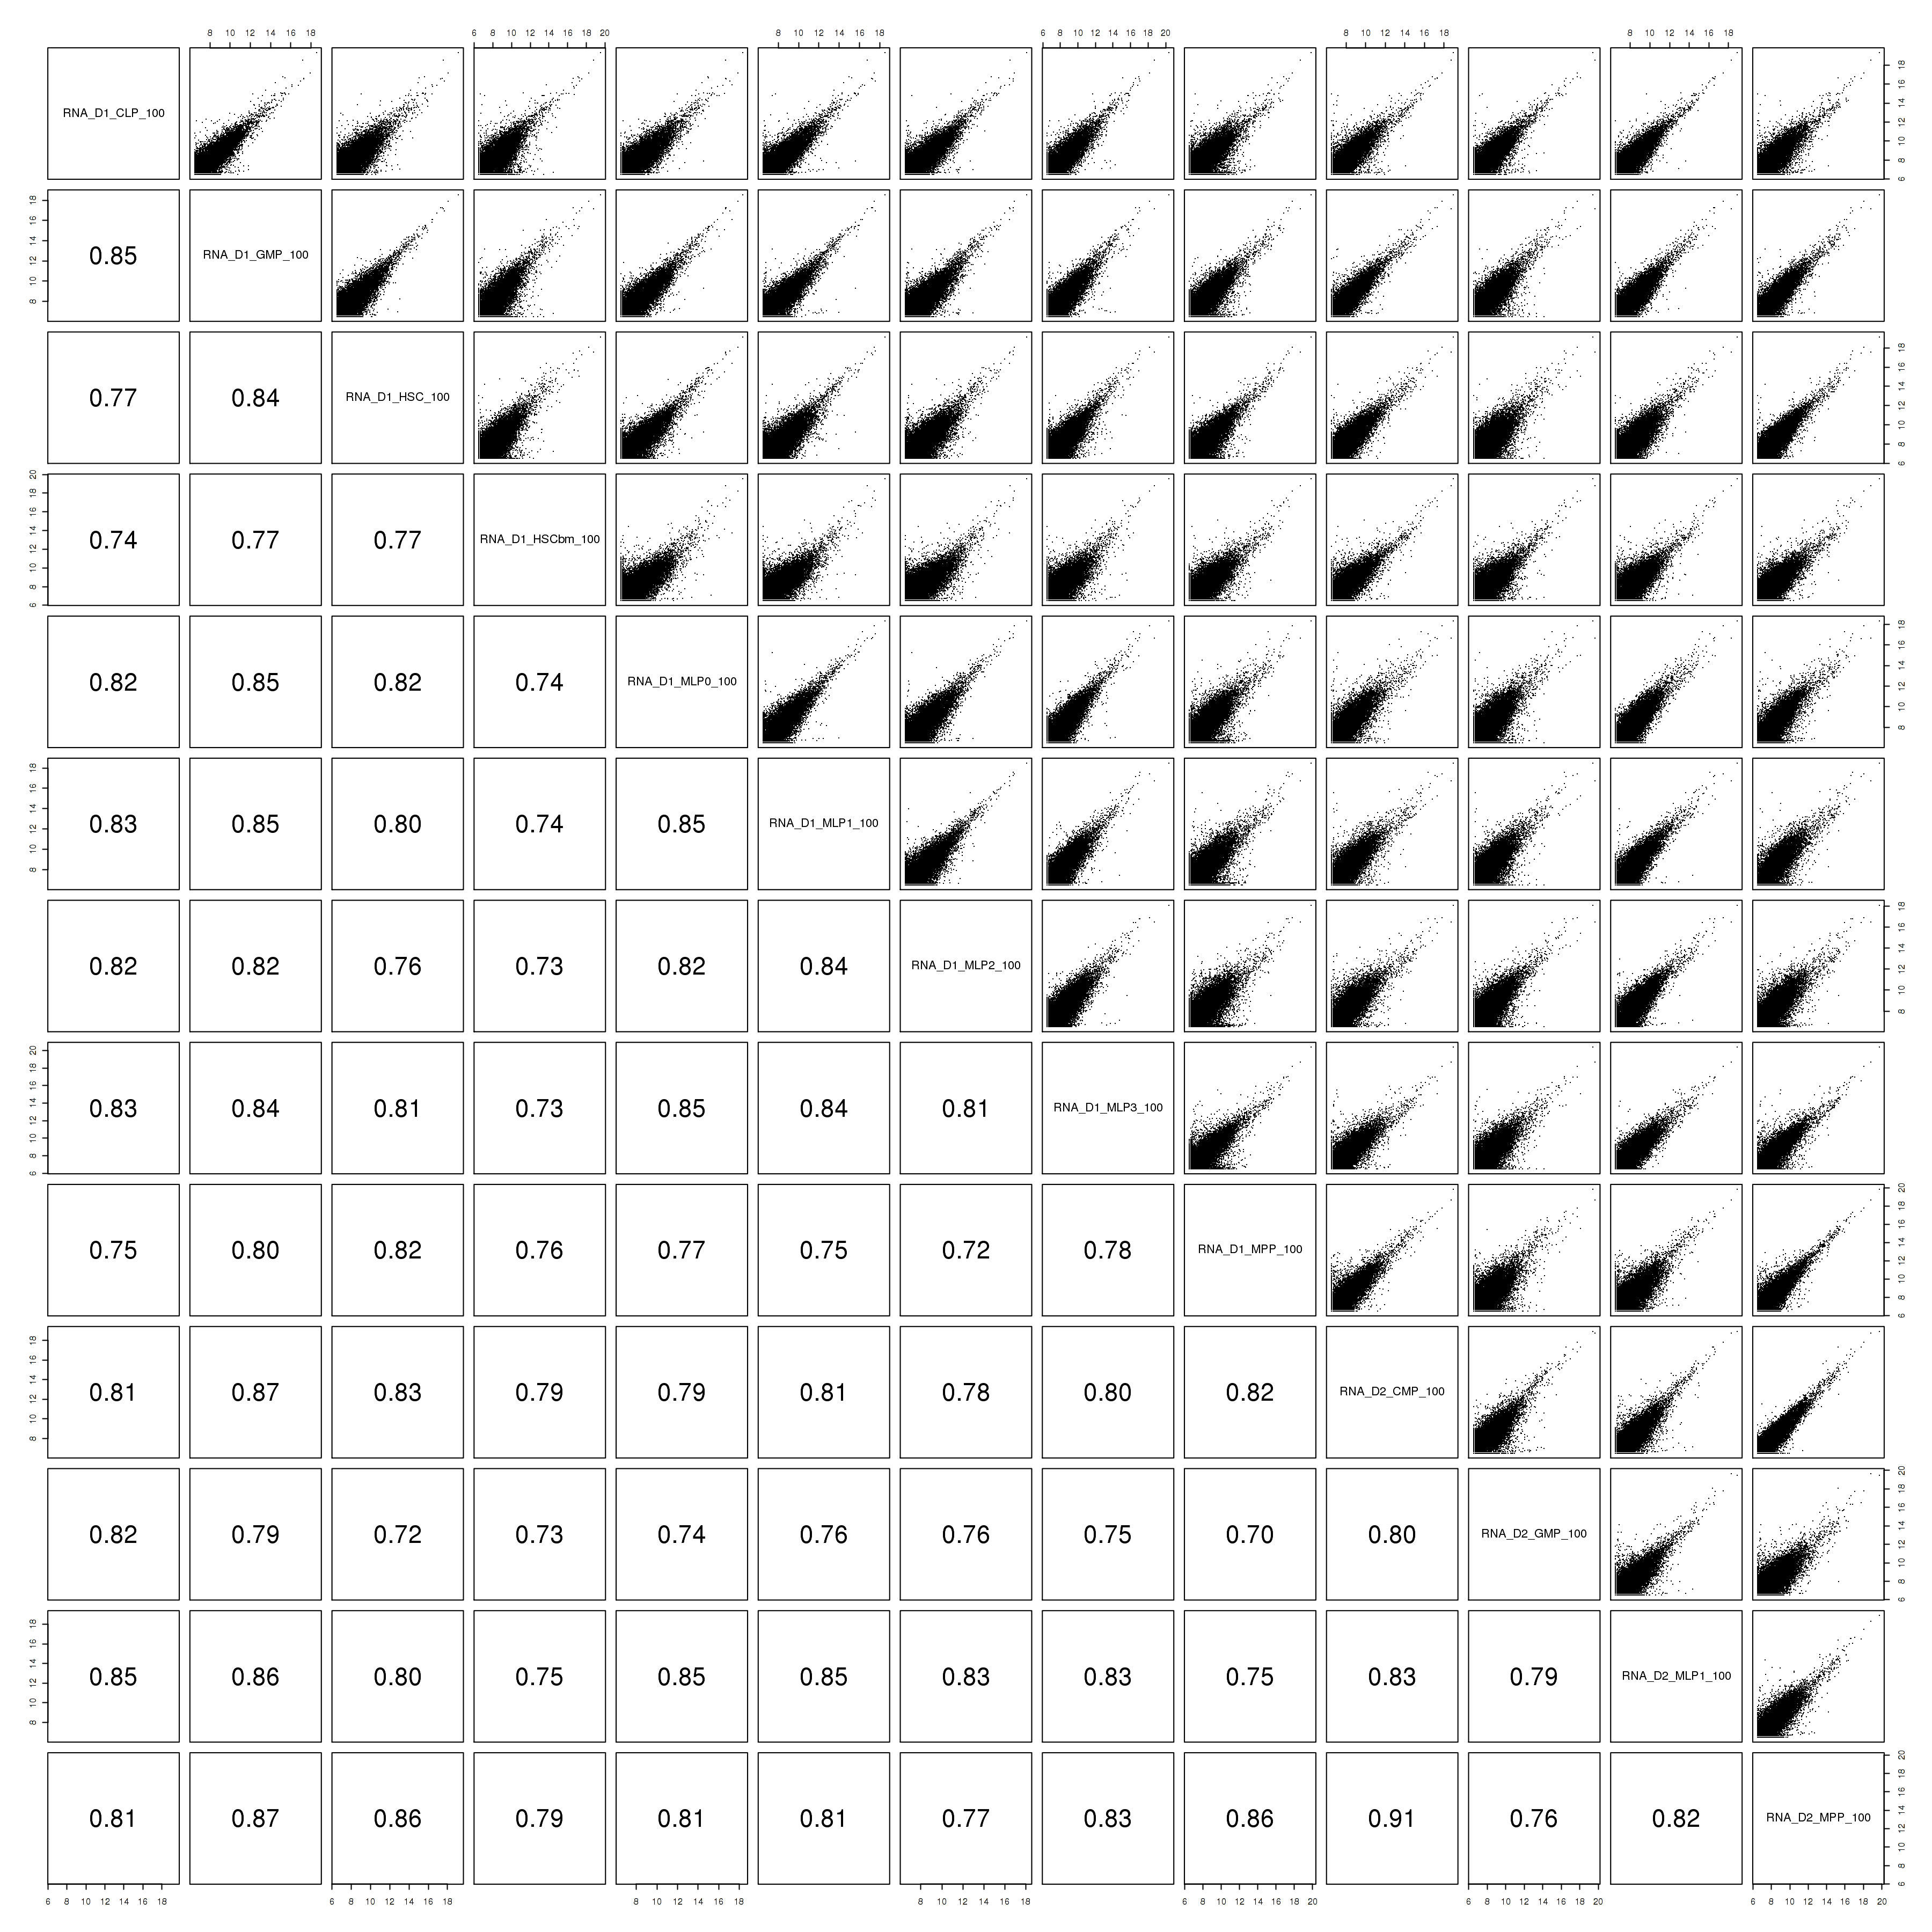
| Combination of 10-cell samples into virtual 50-cell samples |
In our original publication of the μWGBS protocol, we demonstrated that there was no major technical bias affecting DNA methylomes with particularly low amounts of input DNA compared to those with more DNA. We repeated this analysis with the blood progenitor methylomes by comparing "virtual" combinations of five 10-cell samples with "real" 50-cell samples and found that the similarity between both was comprable to that between any two "real" 50-cell samples, indicating that there was no strong bias in coverage. We illustrate this comparison with one MLP3 50-cell sample compared to other real and virtual samples and then extended the analysis to all cell types. Plots (equivalent to Figure 3):
|
Data and links
Links to raw data archives and related resources.
| Name | Description and link | ||||
|---|---|---|---|---|---|
| DNA methylation levels |
|
||||
| RnBeads |
|
||||
| GEO | |||||
| EGA |
|
||||
| IHEC Data Portal |
|
||||
| EpiRR Epigenomes |
|
||||
| DeepBlue |
|
||||
| Medical Epigenomics |
|
||||
| Related publications: |
|


Citation
If you use this resource in your research, please cite:
Farlik M*, Halbritter F*, Müller F*, Choudry FA, Ebert P, Klughammer J, Farrow S, Santoro A, Ciaurro V, Mathur A, Uppal R, Stunnenberg HG, Ouwehand WH, Laurenti E, Lengauer T, Frontini M#, Bock C#, for the BLUEPRINT consortium (2016). DNA methylation dynamics of human hematopoietic stem cell differentiation. Cell Stem Cell. DOI: 10.1016/j.stem.2016.10.019 (Open Access)